Hi, I'm Mohammed Adel
Data Analyst
Transforming raw data into clear, actionable insights. Passionate about uncovering patterns and driving data-driven decisions through advanced analytics.
Data Analyst
Transforming raw data into clear, actionable insights. Passionate about uncovering patterns and driving data-driven decisions through advanced analytics.

Hello! I'm Mohammed Adel , a Data Analyst with a unique blend of financial acumen and technical expertise. I specialize in transforming raw, complex data into meaningful business insights that drive confident decision-making.
With a solid background in Accounting, I bring a financial perspective to data analysis, ensuring accuracy and relevance.
I have recently sharpened my skills through the Digital Egypt Pioneers Initiative (DEPI), specializing in the Microsoft Power BI Engineering Track. My focus is on delivering clear, actionable reports that help organizations spot trends and optimize performance.
Ready to unlock the value hidden in your data?
Contact me – let's make your data speak!
Proficient in a comprehensive suite of analytical tools and technologies
Pandas, NumPy
MySQL, PostgreSQL
DAX, Dashboards
Pivot, VBA
Tableau, Seaborn
Pandas, NumPy
MySQL, PostgreSQL
DAX, Dashboards
Pivot, VBA
Tableau, Seaborn
My Project
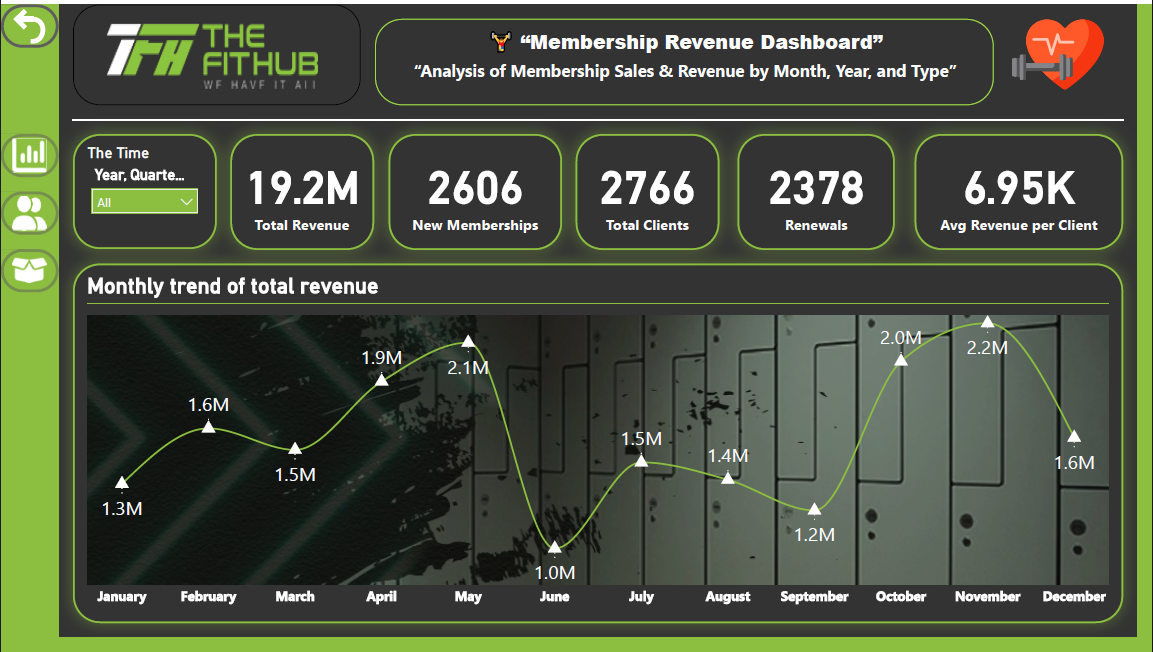
Analyzed $19.2M in membership revenue and identified using Power BI
Tech Stack:

My Project
Sales of 407K were achieved in January, with Jeddah leading as the largest market, and revenues from products D, B and A increased, amid clear daily fluctuations in sales volume.
Tech Stack:
My Project
It targets high-value customers by offering premium customer categories, with these customers accounting for 46% of total orders.
Tech Stack:
Project Description goes here...
Let's discuss how data analytics can drive your business forward
I'm always interested in discussing new opportunities.